Browse Sheets By Problem Type
×


×
Description:
"This worksheet is designed to enhance children's comprehension of histograms. It provides twelve interactive math problems that require the creation and analysis of histograms using various data sets. The resource can be customized and converted into flash cards to accommodate different learning styles. It also supports distance learning environments, making it a versatile tool for teaching fundamental math skills."

×
Student Goals:
Enhanced Understanding of HistogramsUpon successfully completing the worksheet, students will have an enhanced understanding and practical proficiency of how to create histograms. This graphical display of data using bars of different heights is a vital component of maths, statistics and data analysis. Visualization tools like histograms provide a more tangible and simple way for students to understand quantitative data.Develop Data Interpretation SkillsThrough these exercises, students will develop skills to analyse data sets and narrate statistical information by visualizing it onto graphs. These skills are fundamental building blocks in basic mathematics, science experimenataion, and other data-driven tasks, paving the way for advanced statistical analysis in later years of education.Practical Application of Classroom LearningThese problems provide students an opportunity to apply what they have learned in the classroom about histograms. Through continued practice, they will be able to quickly and accurately create histograms, applying their lessons to solve practical problems.Boosts Problem-Solving and Critical ThinkingBuilding histograms requires students to identify relevant data, sort it into logical categories, and then display those categories on a graph without distorting the representation. It cultivates problem-solving skills as students must decide how to best represent their data. This worksheet fosters critical thinking and strategic planning abilities in students.Prepares for Advanced Mathematical ConceptsUnderstanding how to construct histograms prepares students for more advanced statistical and mathematical concepts. Proficiency with histograms is often necessary for understanding distribution, skewness, peaking and other statistics concepts. It allows them to comprehend data patterns, variability, and other higher-level data interpretation skills down the line.Enhances Numeric ProficiencyThe worksheet fosters a better understanding and manipulation of numbers. In doing so, students sharpen their numerical skills and develop precision and speed in calculations.


×
Description:
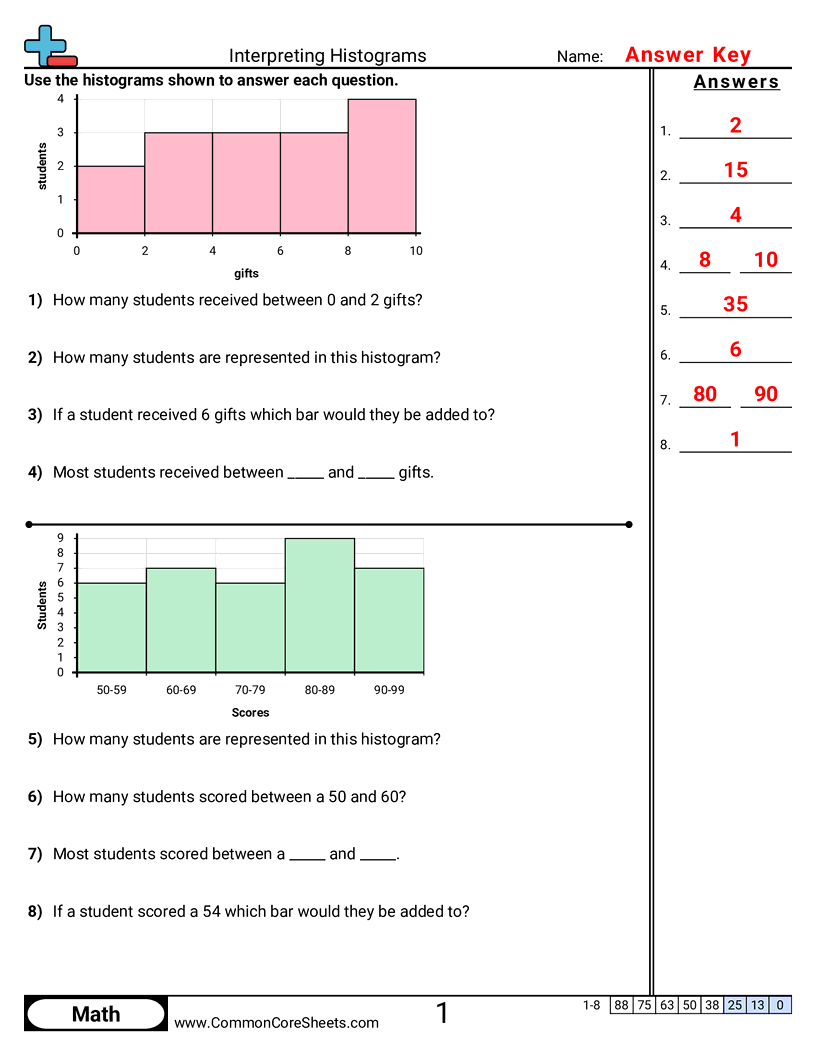
"This worksheet is designed to enhance children's understanding of interpreting histograms in math, sharpening their skillset with 8 interactive problems. It aids in visualizing data distribution and comprehending class scores. Its flexible design allows customization to fit each student's needs and can easily be converted into flashcards or utilized in distance learning settings, making math learning fun and accessible anywhere."

×
Student Goals:
Understanding HistogramsUpon completion of this worksheet, students should have acquired an in-depth understanding of histograms and how to interpret them. They will be able to analyze the frequency distribution of a set of data, presented in the graphical form of a histogram. Having achieved this, they can swiftly identify the range within which most data points fall.Data InterpretationStudents will hone valuable data interpretation skills, equipped to read and analyze histograms in multiple contexts. For instance, they will successfully deduce both the most common and less frequent values within a given set, such as students’ scores or the quantity of goods sold. Their improved ability to spot trends and outliers in data sets will enhance their comprehensive skills in data analysis.Problem Solving SkillsThe worksheet tasks will foster development of problem solving skills. With the application of logical reasoning and mathematical knowledge, students will be able to answer questions based on given histograms effectively. This process of critical thinking will positively impact their ability to solve complex problems and apply these skills in daily situations.Application in Real-World ContextsThrough these exercises, learners will acknowledge the importance of histograms in real-world applications, enabling them to interpret consumer behaviour, survey results, or academic performance, among other practical uses. This knowledge will make them adept at handling, presenting, and interpreting data professionally and academically, facilitating data-driven decision making.Mathematical LiteracyUpon completing the worksheet, students will have made substantial progress in their mathematical journey, particularly in the field of statistics. They will be able to conveying complex ideas and quantitative data in an accessible way using histograms. This important step will reinforce previous studies and prepare them for more advanced mathematical challenges.


×
Description:
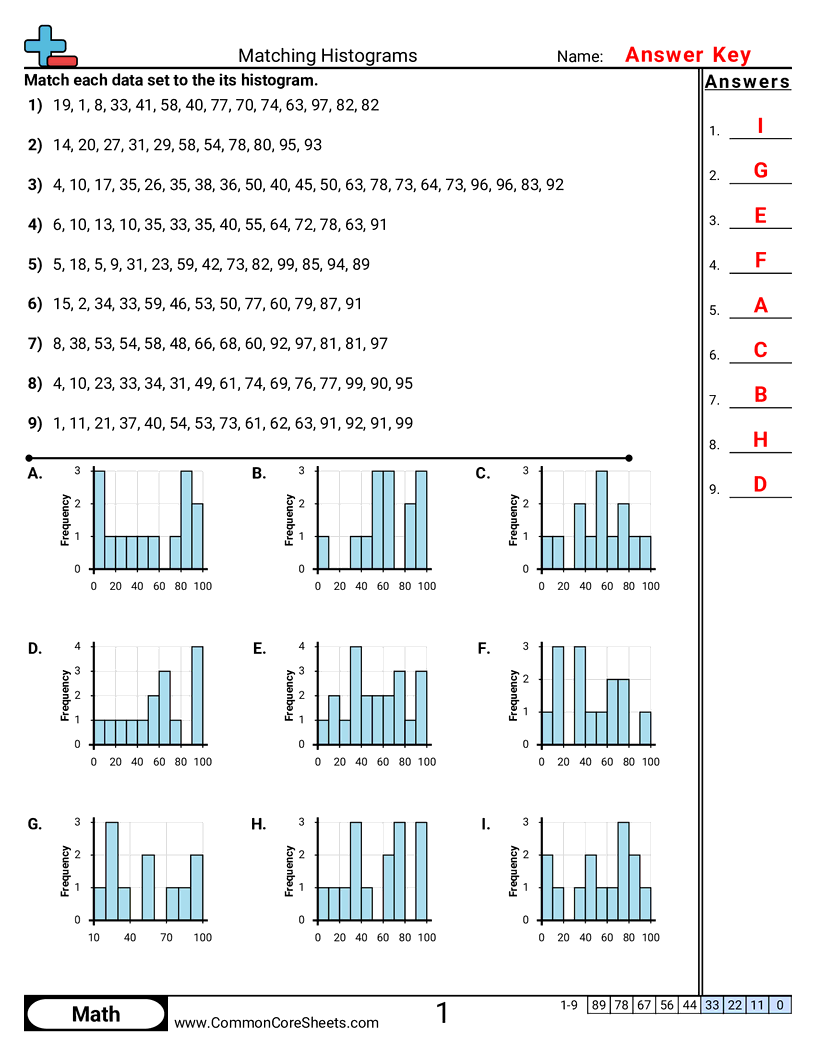
"This worksheet is designed to enhance children's mathematical skills through interactive exercises on Matching Histograms. Consisting of 10 detail-oriented problems, it encourages a deeper understanding of data interpretation and number sequences. The customizable nature of this worksheet allows it to be converted into flashcards or integrated into distance learning modules, adapting effortlessly to diverse learning techniques. A vital resource for mastering math fundamentals."

×
Student Goals:
Understand HistogramsUpon completion of the 'Matching Histograms' worksheet, students will have effortlessly mastered the concept of histograms. They will have a crystal clear understanding of how histograms are used to represent data visually. This experience will provide them with the knowledge that a histogram reflects frequency distribution by representing the frequencies of different ranges of continuous data.Analyze DataAfter successfully finishing the worksheet, students will be proficient in understanding and analyzing different sets of numbers, thus enabling them to recognize patterns and make educated predictions. They will be able to identify trends in data and analyze the shapes and scales of histograms.Improve Problem-Solving SkillsSolving the problems mentioned in the worksheet will help the students to enhance their problem solving and logical thinking skills. These skills are critical as they assist students in developing methods and solutions for different mathematical problems.Develop Proficiency in MathOnce the 'Matching Histograms' worksheet is completed, students will have deepened their understanding and proficiency in math, specifically in the area of data representation. This will lay a strong foundation for additional topics, and provide them with the confidence to tackle more complex mathematical problems in the future.Apply Knowledge in Real-Life SituationsThe knowledge acquired from this worksheet goes beyond textbooks. With continuous practice, students can apply this understanding in their daily lives, like interpreting statistical data represented in newspapers, digital media, or research papers correctly.


